
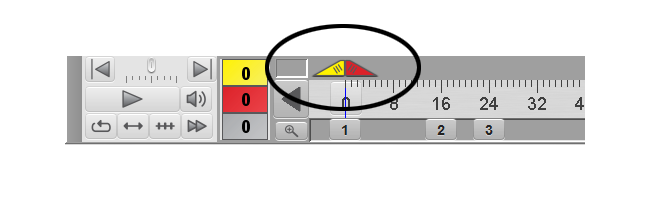
The Count Track is typically located along the bottom of the screen. Its main component looks like a ruler with a tick drawn for every count in the drill. Red and Yellow Anchors can be dragged along the ruler which determines the count of the drill that will be displayed and edited on the screen. The Count Track is very important and is fundamental for the proper operation of Pyware 3D.

During typical use, sliding left-right above the counts of the Count Track are Red and Yellow Anchors.
Directly to the left of the ruler in the Count Track is an area that displays the Red and Yellow Anchor values.

Understanding Anchors
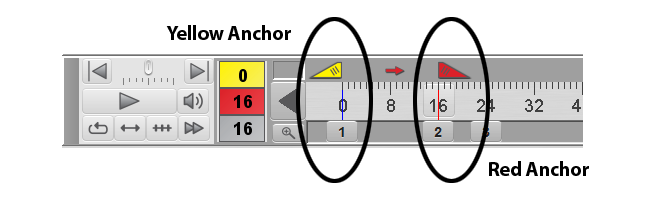
When writing forward the top number represents the count of drill where the Yellow Anchor is located. The next number represents the count of drill where the Red Anchor is located, and the last number represents the number of counts between the Red Anchor and the Yellow Anchor.
The space between the two anchors determines the count range of a transition. The Red Anchor is the ending count of a transition. It is the count where a shape can be edited. At this count, the positions in the formations are displayed on the field in symbols. The Yellow Anchor is the beginning count of a transition and is used as a reference or background chart. By default, the positions at this count are displayed on the field as black dots. In the “old days” when designing on paper or using a light board, the Red Anchor could be compared to the actual sheet you would be drawing on. The Yellow Anchor is the underlying sheet of paper with a formation from the previous set to be used as a reference.
When you start a drill, typically your first step would be creating an opening formation on count 0. You would set both Red and Yellow Anchors to count 0.
After you have created the opening formation, you would then create your transition to the next set by “morphing” or reshaping your opening formation. To indicate the count of the next set and the number of counts in the transition from the last set, you will spread the anchors over those counts. For example, setting the Yellow Anchor at count 0 and the Red Anchor at count 16 will start the next set at count 16 and create a 16 count transition between counts 0 and 16.
You may often notice when moving your anchors forward the locations of the performers on the field do not appear to change, even though you are looking at new counts. This is because no editing has been done at those counts, so the performers are holding in place.
To design the formations of the next set, you will select shapes and use the edit tools to reshape them. In the example, our Red Anchor is at count 16 and therefore the formations (or shapes) we are editing are at count 16. Since the Yellow Anchor is at count 0, the transitions between count 0 and 16 are automatically created for you.
Again, for example, if you wish the next transition to be between counts 16 and 40, you would move your anchors where the Yellow Anchor is at count 16 and the Red Anchor is at count 40.
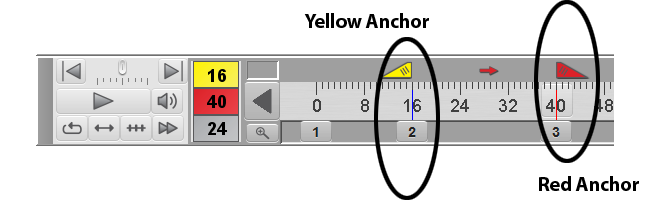
Now you are looking at count 40 on the field. Since count 40 is currently marking time from count 16, the secondary (background) chart at count 16 that is normally displayed is directly under the primary chart (count 40). You will now reshape the formations at count 40 and the transition counts between 16 and 40 will be automatically created for you.
Why the Count Track is Awesome
The great thing about the Count Track is that transitions can begin and end on ANY count. You are not restricted to beginning and ending every transition at the same counts in the drill. Some transitions may span over several printed charts. In our example we created a set of transitions that span from 0-16 and from 16-40, so typically we would print a chart at 0, 16 and 40.
But what if you also wanted a group of performers (let’s say the guard) to travel from 0 to 40 in a single transition? That is easy! Set the Yellow Anchor to 0 and your Red Anchor to 40. Reshape the formations that make up the guard and you’re done. The placement of the guard at count 16 (as with the other transition counts) are automatically created for you.
Another great thing about the Count Track is that with this approach you do not re-create a chart from scratch at each set. With 3D, you are usually re-shaping the formations of a count (at the Red Anchor) based on a formation’s shape at a previous count (at the Yellow Anchor). Since the transitions are evolutionary, it is almost always easier to build a chart from its predecessor than to create the new chart from scratch. The Tutorial that follow will help you better understand how this concept works.
NOTE: Dragging the Yellow Anchor through the count of the Red Anchor will leap frog the anchors. This time saving feature allows you to continue on to the next set by moving just one anchor instead of two.
Post your comment on this topic.