
Any count of a drill can be printed in 3D. Most users, however, only want printouts at set points.
Charts can be printed by count number or set number. Sets are determined by the location of Page Tabs on the Count Track. Prior to printing, you may want to add or remove certain page tabs from the Count Track so the sets will print out according to your preference.
Selecting Print Charts from the File will display the following screen:
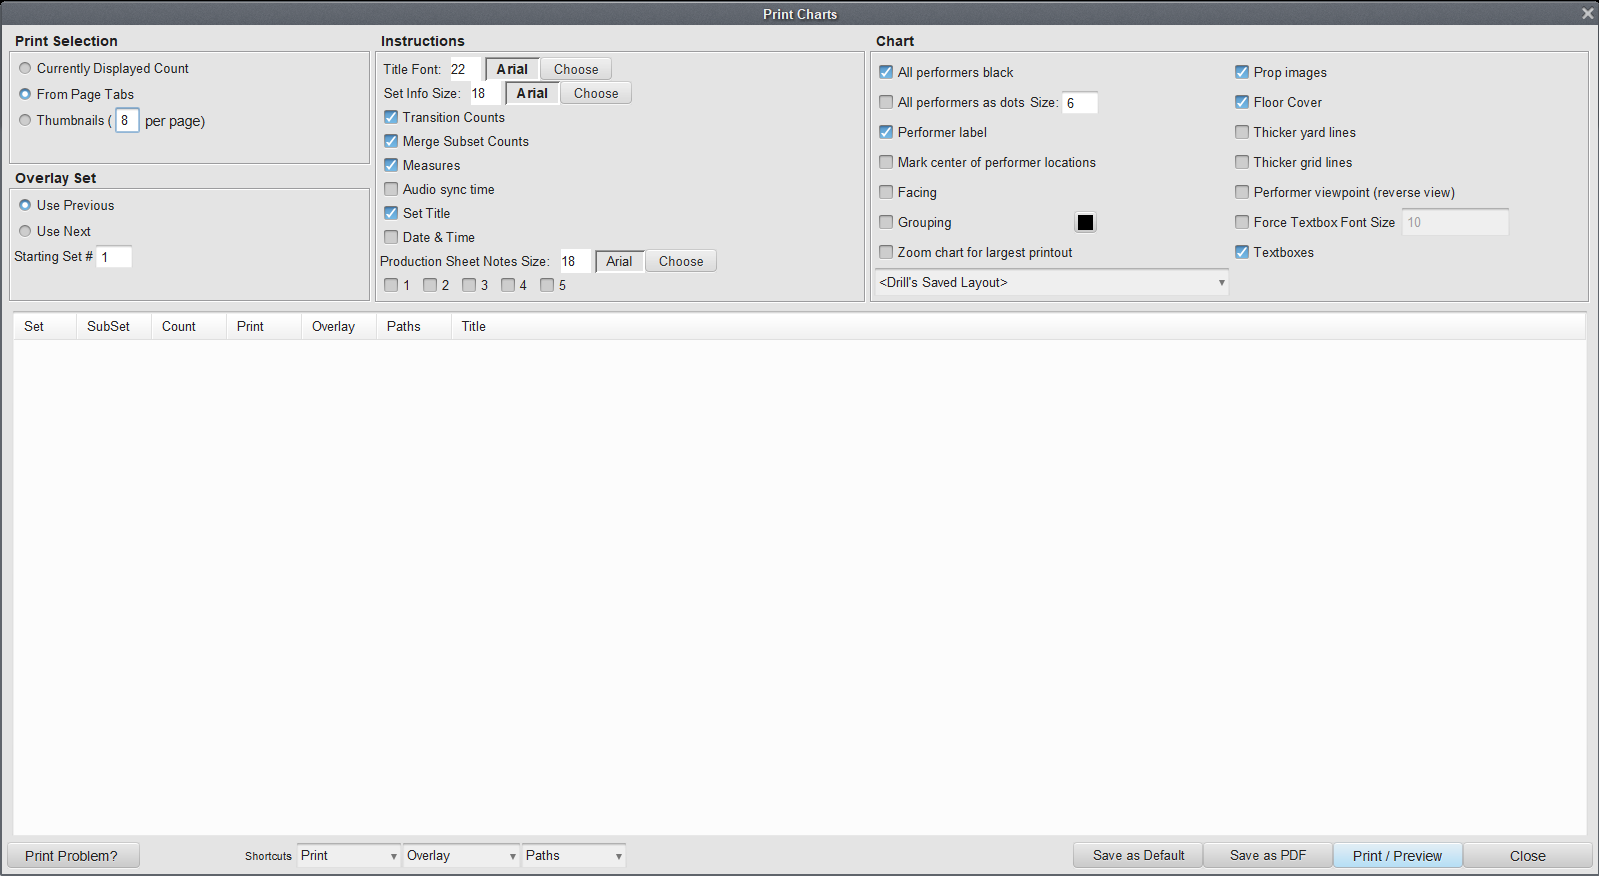
Print Selection options are used to determine which counts of a drill are printed.
From Page Tab will print the selected page tabs in the Print Charts dialog.
Currently Displayed Count will print the current count displayed. The displayed count is determined by the location of the Red Anchor.
Thumbnails per page will print small grids to fill the page. Ideal settings for dotbooks are 8 thumbnails per page in portrait orientation, or 4 thumbnails per page in landscape orientation.
Instructions
Title Font changes the size of the Drill Title and Author Information.
Set Info Size changes the size of the Set #, Transition Counts, Measures and Set Title on each drill chart print out.
Transition Counts prints the counts for that particular set at the bottom of the chart.
Merge Subset Counts When this option is selected, subsets that are NOT set to print will have their count range merged with the count range of that transition.
Measures when selected will print the Measures (from the Production Sheet) at the bottom of the chart.
Audio Sync Time will include the audio sync time with the set information at the bottom of each chart.
Set Title will print the Set Title (from the Production Sheet) at the bottom of each chart.
Print Date & Time will print the date and time on the chart printout.
Production Sheet Note will print information from the Production Sheet Notes columns at the bottom of the chart printout, below the field. Check the corresponding box for each Production Sheet Note column you wish to be printed.
Chart
All performers black is useful when it is important to make clear black and white reproductions of the printout. On color printers, this option may be useful because the color symbols will not copy as clear when in color. On black and white printers, this option is helpful as colored symbols will be printed in a shade of gray, and will not copy as clearly as if they were black. If you plan on reproducing the printouts, we suggest using the “all performers black” option.
All performers as dots converts all symbols from the drill to dots on the chart printouts.
Performer label determines whether a label is printed (usually a number) beside each performer’s symbol. Normally, if labels were entered with the Performer Labeling tool, this option is checked.
Mark center of performer locations will place a dot in the center of the positions where the performer will be standing.
Facing will indicate which way the performers face for each symbol on the field.
Grouping prints the matching lines between performers. You can specify the color by clicking on the color picker, then assigning the color of your choice.
Zoom chart for largest printout will print zoomed in charts. The printout will be zoomed in as much as possible while still keeping all performers in the viewable area. When selecting this preference, options will display for determining which charted items are visible in the printout when zoomed.
Grid Layout Menu You can quickly change the grid layout by selecting a different option in this menu. This is helpful if you have different grids for designing and printing.
Prop images enables props to be printed. If this option is unchecked, the bounding area for the prop will print.
Floor Cover enables a floor cover to be printed. Uncheck to hide the floor cover during printing.
Thicker yard lines will thicken the yard lines.
Thicker grid lines will thicken the grid lines when printed.
Performer viewpoint (reverse view) will print the charts from the performer’s perspective.
Force Textbox Font Size will force the text box font to print at the size that you specify in this option.
Textboxes, when selected, will print text boxes and arrow indicators on the drill chart printouts.
Overlay Set
Overlay Set has two options: Use Previous and Use Next. If a chart selection includes an overlay, Use Previous will print the previous set as a background chart. Likewise, Use Next will print the next set as a background chart.
Starting Set # will change the starting set number. For example, if the first drill ends with page tab 23, the continuation file can begin with page 24.
Shortcuts Menus
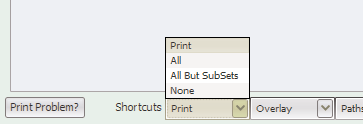
The Print shortcut menu will remove or add all of the checks from the selection boxes in the print column. Charts will only print if they have a check in the selection box of the Print column.
Overlay will remove or add all of the checks from the selection boxes in the Include Overlay column.
Paths menu will select all, none, or mid-point options to print paths.
Options of the Print Charts Table
Sets and SubSets are derived from the Page Tabs on the Count Track. A chart should typically be printed at each page tab, and each page tab is a set. However, it is sometimes useful to create a page tab at a location where you don’t necessarily need a printed chart. These page tabs are known as sub-sets. Sub-sets do not advance the total number of pages. For example, if we had two sub-sets between pages 2 and 3, the numbering sequence would be 1, 2, 2A, 2B, 3, 4, etc.
The Print column in the table enables/disables the printing of selected sets.
Overlay enables/disables printing of a background chart for selected sets.
Paths can be set to none for no paths printed, all paths for a dot per step for every performer, or path midpoint for a single dot for each performer marking the midway point to the next set.
The Title column in the table can be used to enter a title for the set to be printed along the top of the printed chart.
Close will exit the Print Charts window.
Save as Default will save the settings you set for options in Print Preferences as default values. Print Selection will not be saved.
Save as PDF will save the selected charts as a PDF document instead of printing a physical copy. Note that PDF printouts created this way are intentionally set to a high resolution. This may dramatically increase the file size of the PDF document.
Print/Preview opens the print preview and page setup dialog.
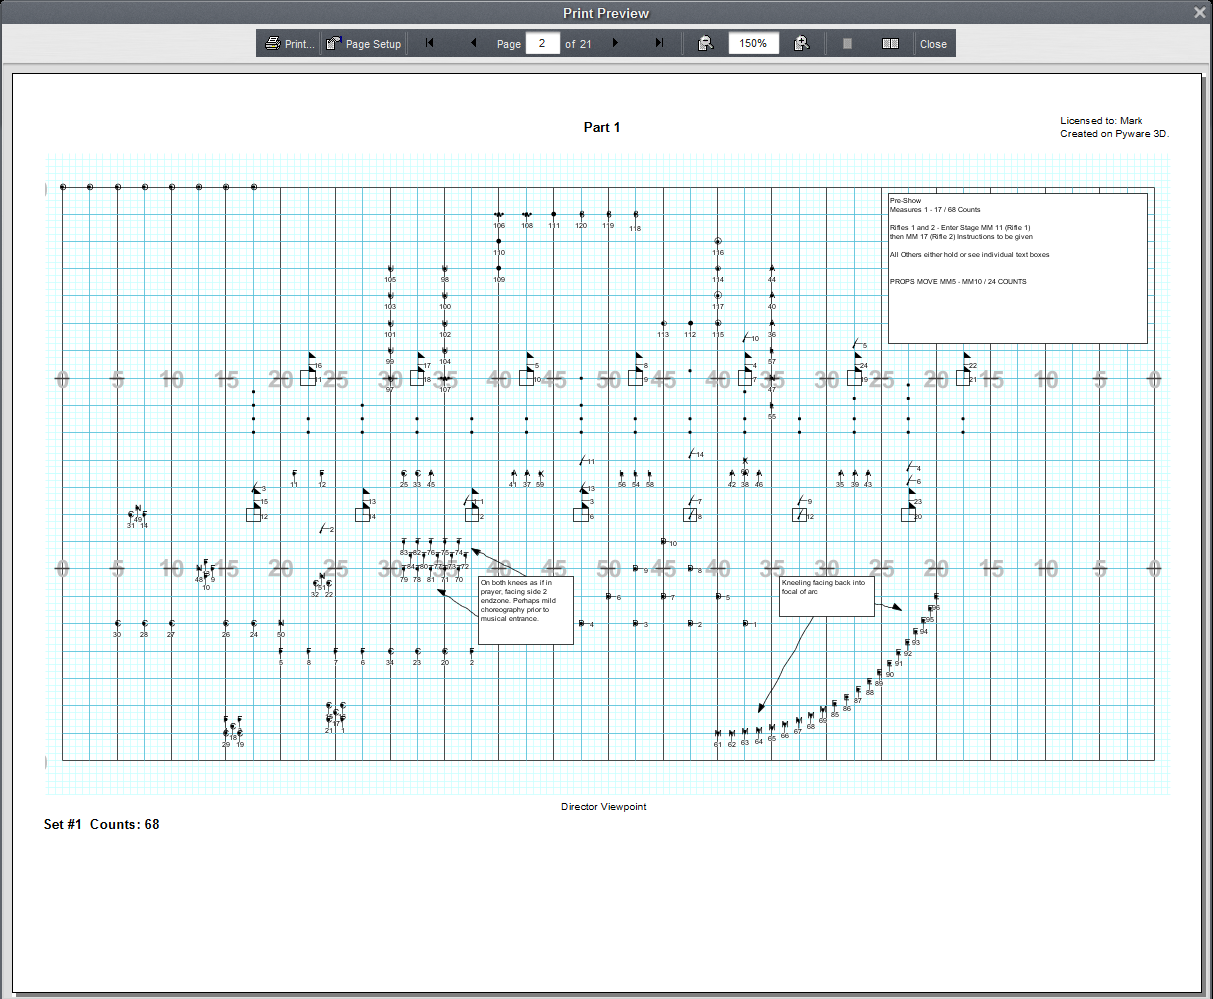
Print will send the job to the printer.
Previous Page will move to the previous preview page of the print job.
Next Page will move to the next preview page of the print job.
Page Setup opens the printer’s page setup dialog.
Done closes the print preview and returns to the Print Charts dialog.
Post your comment on this topic.